A living biodiversity program your tenants see.
Alvéole puts beehives and pollinator habitats at your properties. Tenants participate. The program generates biodiversity and engagement data structured for GRESB, CSRD, and TNFD.

Trusted by leading portfolios


Most sustainability programs produce reports.
This one produces experiences and then reports on them.
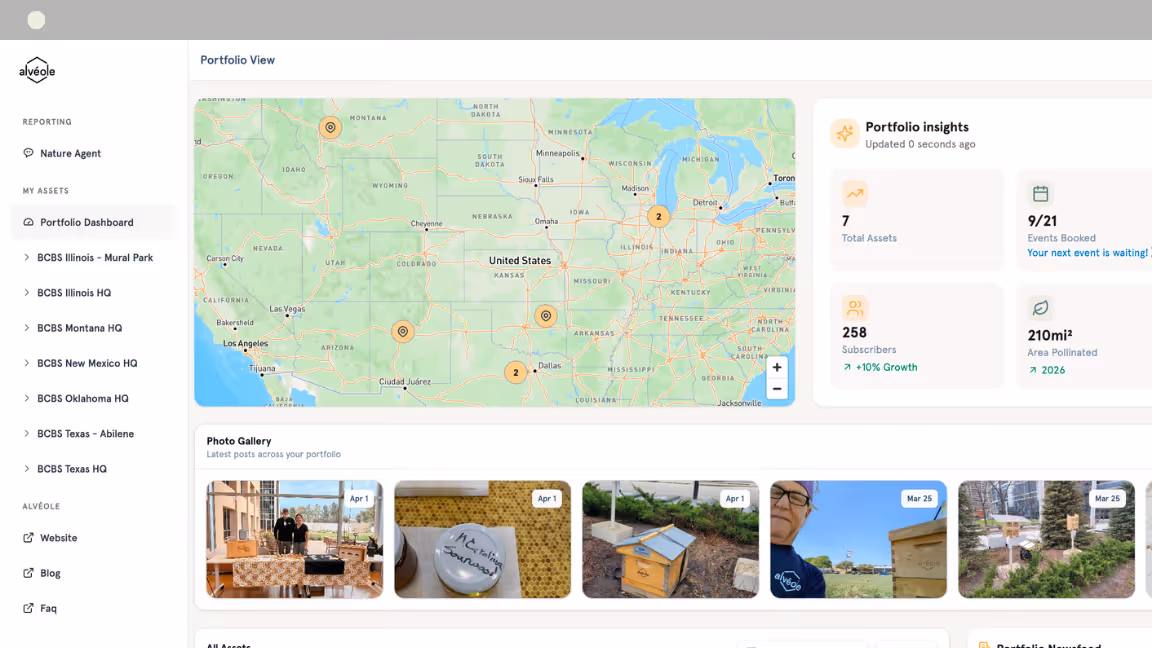
On-site biodiversity activity
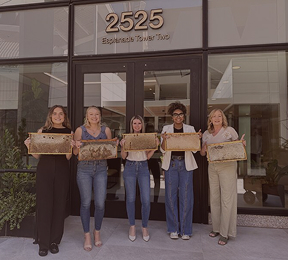
A living program at your properties. Not a policy statement. Something tenants can see and touch.
Tracked tenant participation
Engagement data captured automatically across all assets. No manual follow-up.
Metrics aligned with GRESB and ESG frameworks
Indicators structured for GRESB, CSRD, and TNFD submissions.
Integrated environmental and social data
Biodiversity activity and tenant engagement in one report.

How it works
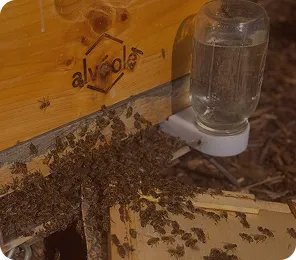
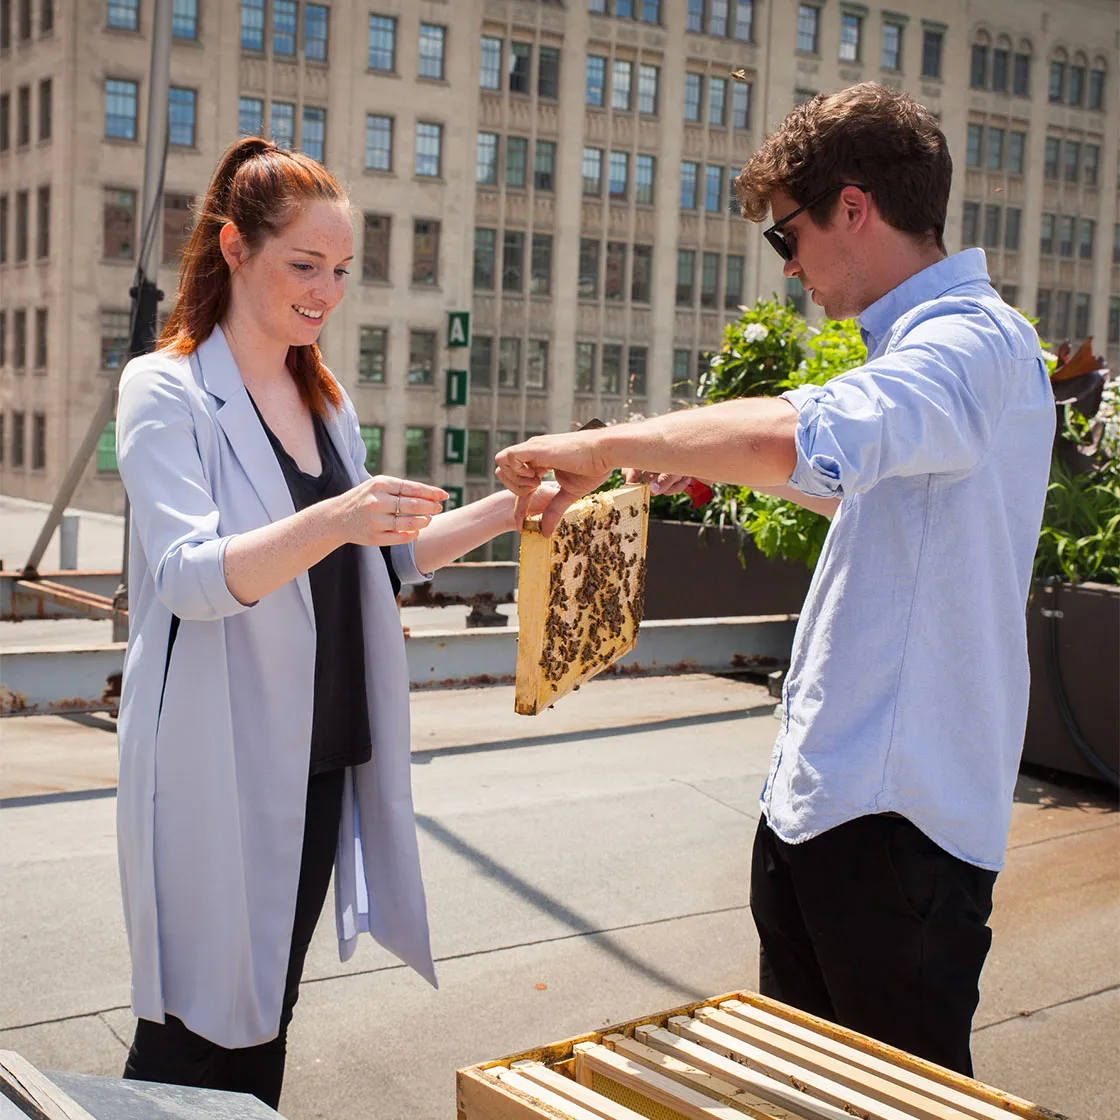
Beehives and pollinator habitats
Installed and maintained by our beekeepers at your properties. Visible on-site biodiversity activity from day one.

Tenant engagement built in
Workshops, hive visits, and beekeeper updates. Tenants participate directly in the program.
Participation tracking
Attendance and subscriptions recorded automatically through the platform.
Reporting-ready metrics
Biodiversity and participation data structured for sustainability updates and annual reports.

Portfolio consistency
Same program, same data structure, across office, retail, multifamily, and industrial.
Biodiversity and engagement data you can report on.
Biodiversity & tenant engagement indicators (GRESB)
On-site activity and participation data structured for GRESB biodiversity and social indicators, consistent across all assets.
Nature-related risk & opportunity disclosure (TNFD)
Habitat and program data aligned to the TNFD LEAP framework for asset-level nature disclosures.
Double materiality & biodiversity reporting (CSRD)
On-site activity and engagement records structured for ESRS E4 disclosures.
Annual sustainability reports & LP communications
Participation rates and biodiversity summaries ready for annual reports and LP questionnaires.
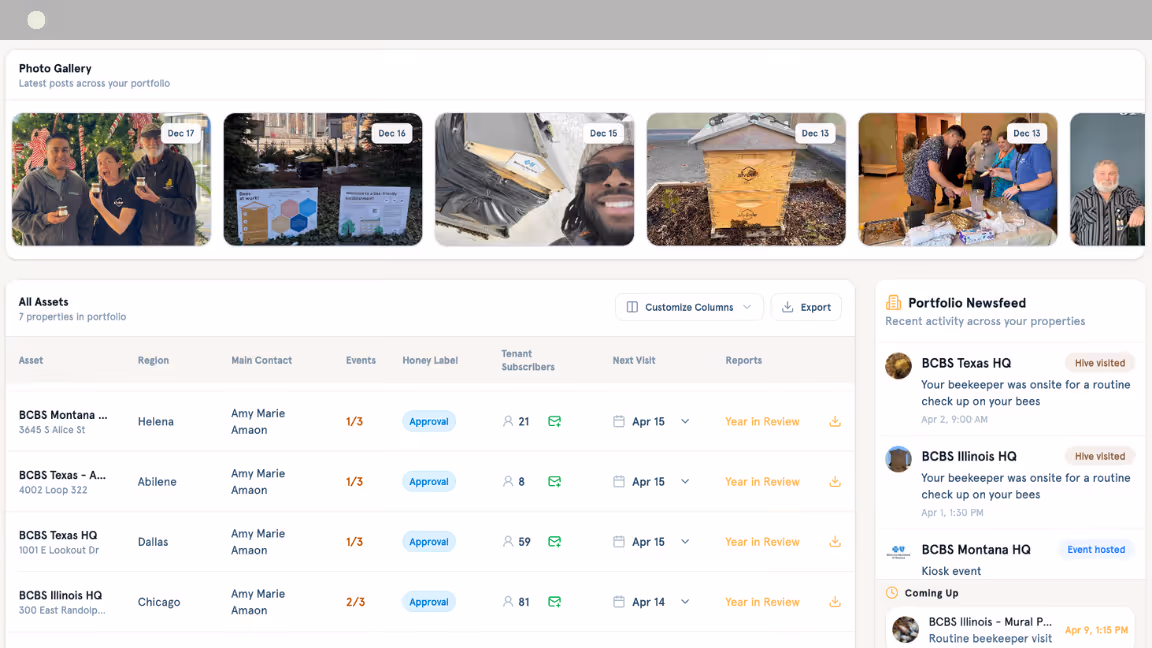
Every metric tracked automatically, available in your dashboard at any time.
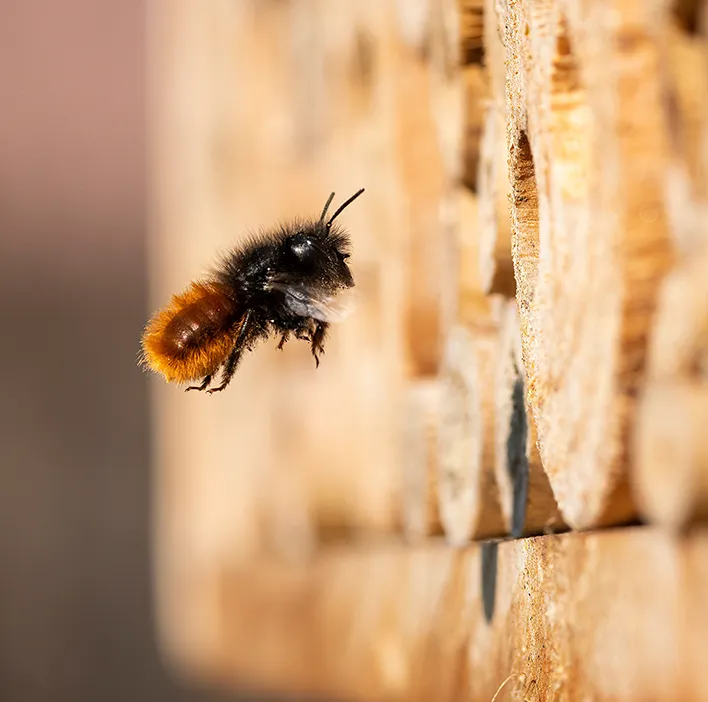
Pollinator species and habitat activity indicators
Year-over-year engagement trend data
Portfolio-level rollup across all enrolled assets
Export-ready format for GRESB portal submission