
The top buildings in Chicago for nature & biodiversity
The highest-performing building in Chicago for nature and biodiversity is 1340 South Damen Avenue, achieving an overall score of 85.45. This ranking is based on location-specific metrics including natural land cover, species abundance, and proximity to sensitive protected areas, utilizing data from the European Space Agency, the Global Biodiversity Information Facility (GBIF), and the World Database on Protected Areas (WDPA).
As biodiversity risks move to the forefront of commercial real estate strategy, asset managers and sustainability teams are facing increased pressure to quantify the environmental impact of their portfolios. Whether responding to investor due diligence questionnaires (DDQs) or preparing corporate sustainability reports, understanding how a building interacts with its surrounding ecosystem has become essential to risk management.
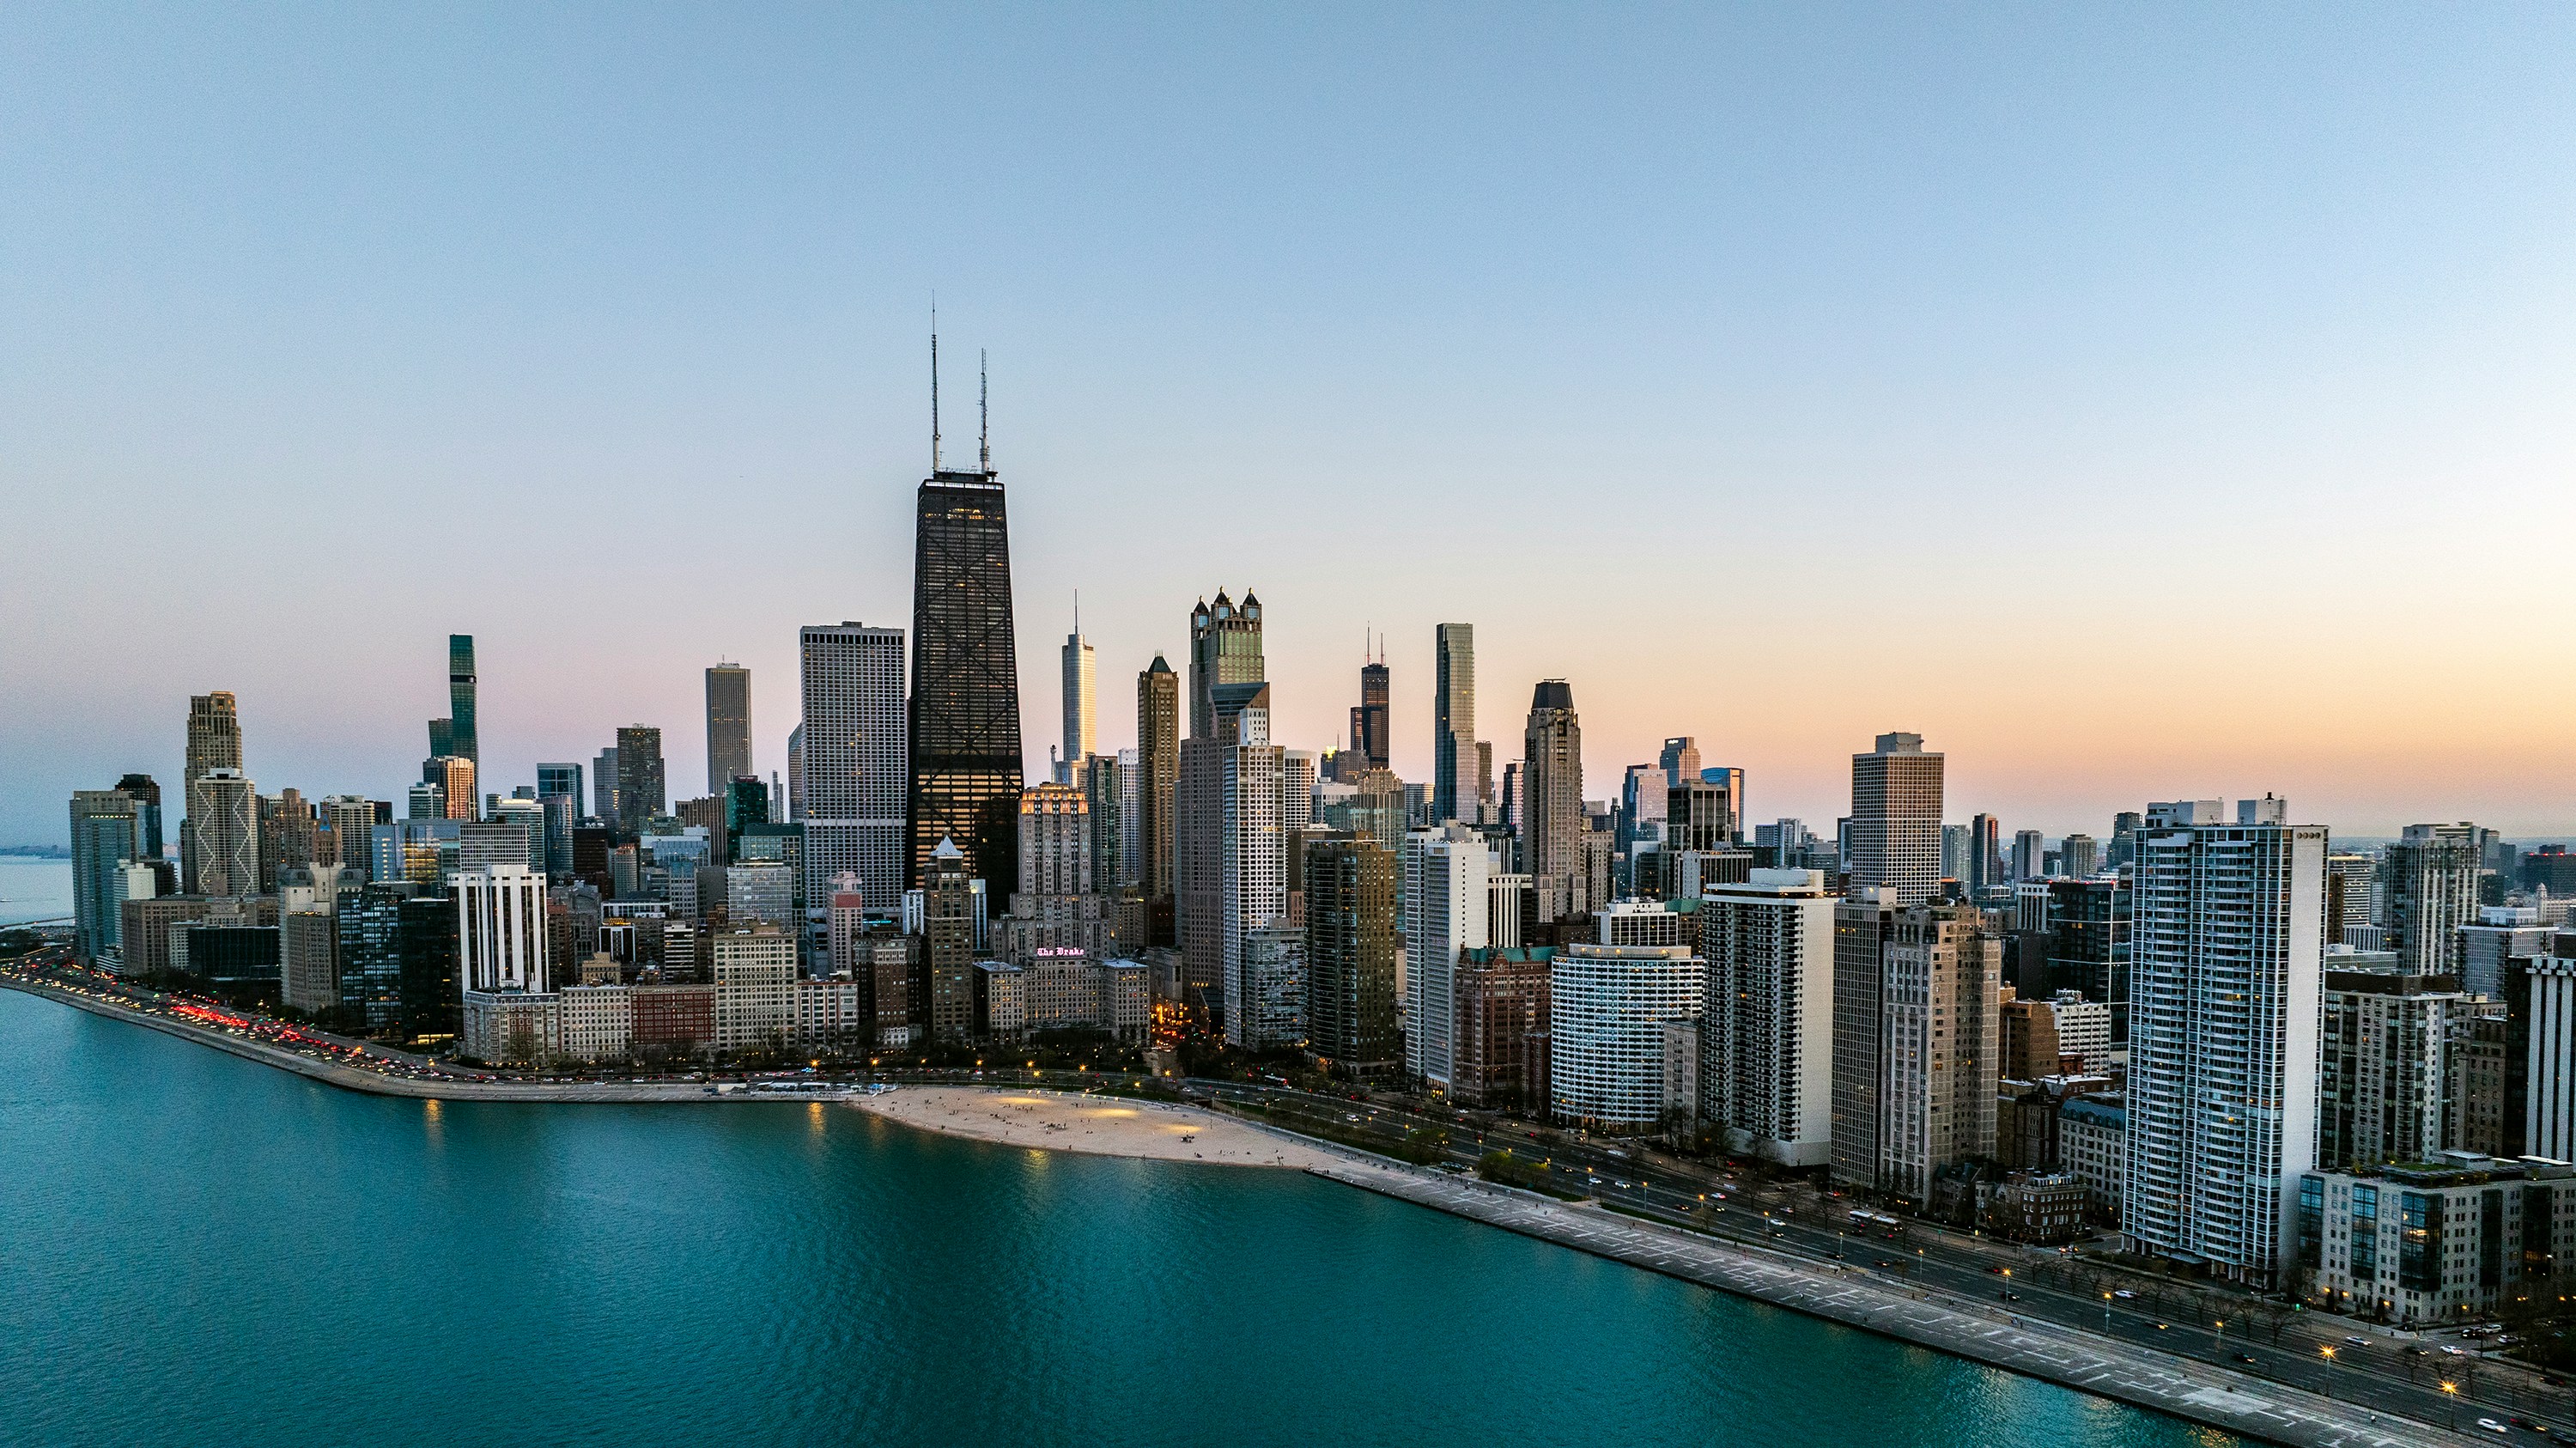
In Chicago, where industrial corridors, urban greenways, and lakefront developments shape the landscape, specific assets stand out for their ecological context.
Top 10 Chicago Buildings: Nature & Biodiversity Rankings
The following table displays the top-performing properties in our Chicago dataset. These scores reflect how each site compares to others across the region based on four core biodiversity metrics.
| Rank | Address | Natural Cover | MSA Land Use | Threatened Species | Overall Score |
|---|---|---|---|---|---|
| 1 | 1340 South Damen Avenue | 18.64% | 0.227 | 2 | 85.45 |
| 2 | 3000 South Damen Avenue | 13.76% | 0.198 | 3 | 82.63 |
| 3 | 10 West 35th Street | 15.69% | 0.199 | 4 | 81.52 |
| 4 | 1749 North Wells Street | 34.57% | 0.385 | 11 | 79.68 |
| 5 | 1730 North Clark Street | 34.20% | 0.382 | 11 | 79.52 |
| 6 | 633 West North Avenue | 15.33% | 0.196 | 5 | 77.85 |
| 7 | 900 S Ada Street | 22.62% | 0.265 | 3 | 77.67 |
| 8 | 2750 West Roosevelt Road | 32.64% | 0.363 | 7 | 77.59 |
| 9 | 900 S Ada St, Chicago, IL 60607 | 22.71% | 0.266 | 3 | 77.56 |
| 10 | 175 North Harbor Drive | 19.94% | 0.341 | 11 | 77.55 |
Note: Rankings and Overall Scores are derived by computing what percentile a given site falls into compared to other buildings in the regional dataset for each metric, and averaging those percentiles. All data points are drawn directly from location-specific baseline records.
See how your asset stacks up. Try the Aura Free tool below.
Analyzing Chicago's Ecological Patterns
The data reveals distinct geographic and structural trends across Chicago's top-performing assets.
Urban Density vs. Habitat Intactness
Properties located near major park systems or the lakefront corridor, such as 1749 North Wells Street and 1730 North Clark Street (situated near Lincoln Park), exhibit the highest Natural Cover (over 34%) and the strongest MSA Land Use values (exceeding 0.38) in the top 10. In practical real estate terms, these surrounding environments are highly intact and capable of supporting diverse urban wildlife. However, this proximity to high-quality habitat also correlates with a high Threatened Species Total (11 species observed at both locations), indicating a complex ecological setting that requires careful management and sensitive outdoor lighting or glazing strategies to mitigate wildlife disruption.
Industrial and Infill Strengths
Conversely, the overall rankings leader, 1340 South Damen Avenue, balances moderate natural cover (18.64%) and lower threatened species exposure (2 species) with highly favorable comparative placement across the broader regional dataset to claim the number one spot. This demonstrates that assets do not need to be adjacent to premier nature reserves to achieve strong biodiversity scores; standard infill locations often maintain lower localized risk complexities while outperforming heavily sealed urban cores.
Explore these top-ranked buildings directly in the interactive tool on this page to see how baseline ecological data shifts from block to block.
Understanding the Core Metrics
Aura relies on four primary data streams to evaluate building-level biodiversity performance, providing sustainability professionals with clear answers for investor questionnaires and framework alignment.
- Natural Cover Represents the share of land within a 500-meter radius of the building that is green or natural (such as vegetation, water, or soil) rather than artificial, paved surfaces. Higher percentages indicate stronger surrounding habitat availability. Data Source: European Space Agency (ESA)
- MSA Land Use (Mean Species Abundance) Acts as a proxy for ecosystem condition and ecological intactness within a 500-meter radius. It measures how close the surrounding environment is to a natural state. Higher values indicate a healthier ecosystem better able to support native biodiversity. Data Source: Combines European Space Agency data with the Globio model
- Biodiversity Sensitivity Exposure (PASI) The Protected Area Sensitivity Index measures a building’s proximity to and exposure to nearby protected or environmentally sensitive lands, accounting for both distance and the size of those protected areas. Higher raw values show greater proximity to biologically significant regions. Data Source: World Database on Protected Areas (WDPA)
- Threatened Species Total Tracks the documented presence of species classified as threatened or at risk (including vulnerable, endangered, or critically endangered classifications) within a 1-kilometer radius, filtering for observations reported within the last 10 years. High totals indicate localized management complexity. Data Source: Global Biodiversity Information Facility (GBIF)
How to Use This Data for Your Portfolio
For commercial real estate teams managing Chicago assets, these location insights offer immediate business utility:
- Streamlining Investor Requests: When an investor asks for disclosure regarding assets located in or near biodiversity-sensitive areas, these metrics provide the precise, science-backed indicators needed to populate DDQs confidently.
- Pre-Acquisition Benchmarking: Before acquiring a new property in the Chicago metropolitan area, asset managers can run a location assessment to evaluate future nature-related risks, ecological liabilities, or conservation opportunities.
- Placemaking and Tenant Retention: Properties operating in zones with strong natural cover often benefit from enhanced biophilic value. Real estate teams can leverage these surroundings to design better tenant experiences, promote wellness, and support corporate tenants' own sustainability goals.
Check whether your own asset shares these regional strengths. Use the tool on this page to query your portfolio addresses and access your instant nature risk overview.
Want these benchmarks for your whole portfolio? Book an Aura demo.